Introduction

Wi-Fi Radar System 2.0 is a scientific research and teaching platform for wireless sensing that includes signal analysis and human motion detection. Signal analysis module can help researchers and students to collect, observe and record wireless signal features (CSI and RSSI) in real time so as to find the factors that affect the signal variation and inspire innovative research and applications. As a typical application of wireless sensing, human motion detection can help students understand and learn the application of WiFi radar technology and inspire their innovative thinking.

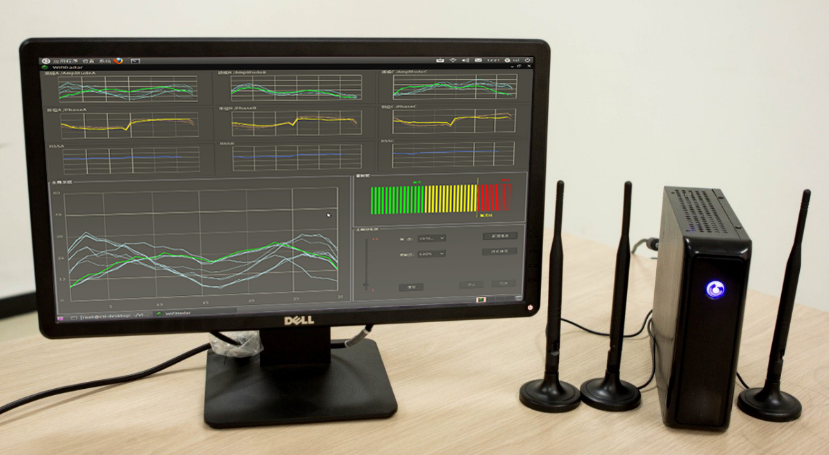
Figure 1. Wi-Fi Radar System Interface


Wi-Fi Radar 2.0 adds CSI phase processing module to WiFi Radar 1.0 to provide robust CSI phase information. It supports display of CSI information for all three antennas and real-time control of the sampling frequency; Also, it supports multiple receivers to implement remote distributed environmental sensing experiment.

​System Environment and Program Start

Wi-Fi radar system consists of back-end program (data generation and transmission) and the front-end program (data display and collection). The back-end program needs to run on a microcomputer equipped with a transmitting antenna. The front-end program needs to run on any device that support java environment and be installed in the same local area network. Below is entire process of starting this system.

​Starting Back-end Program

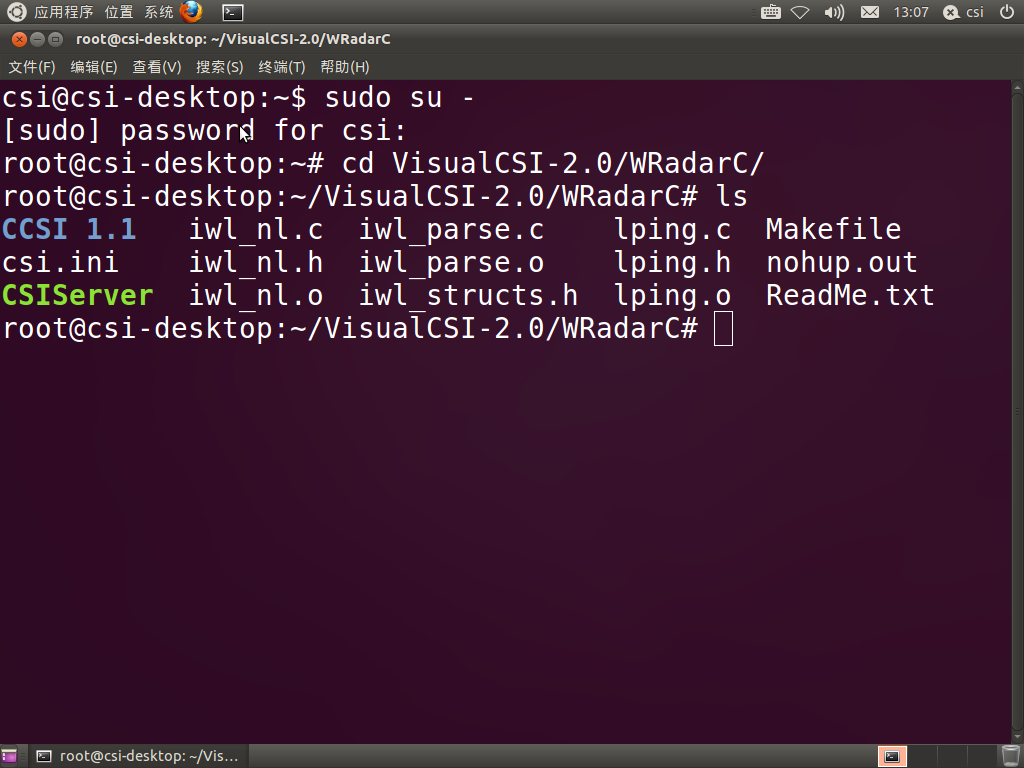
Figure 2. System executing command

1. ​Open the terminal
2. ​Switch to root user
$su root
3. ​Enter system password:123456
4. Go into VisualCSI-2.0/WRadarC directory
$cd Desktop/VisualCSI-2.0/WRadarC
5. ​Configure system parameters
$vi csi.ini
6. ​Run the back-end program
$./CSIServer


​Starting Front-end Program


Figure 3. System starting interface
1. ​Go into VisualCSI-2.0 directory
$cd Desktop/VisualCSI-2.0/
2. ​Run VisualCSI.jar program
$java -jar VisualCSI.jar
​At this point you will see the pop-up VisualCSI startup window "WIFI Radar”, as shown in Figure 3.

​Instructions of Real-Time Visualization System

The real-time visualization system of WiFi radar data can be divided into two parts:
1. ​Real-time management of signal features
2. ​Human detection alarms

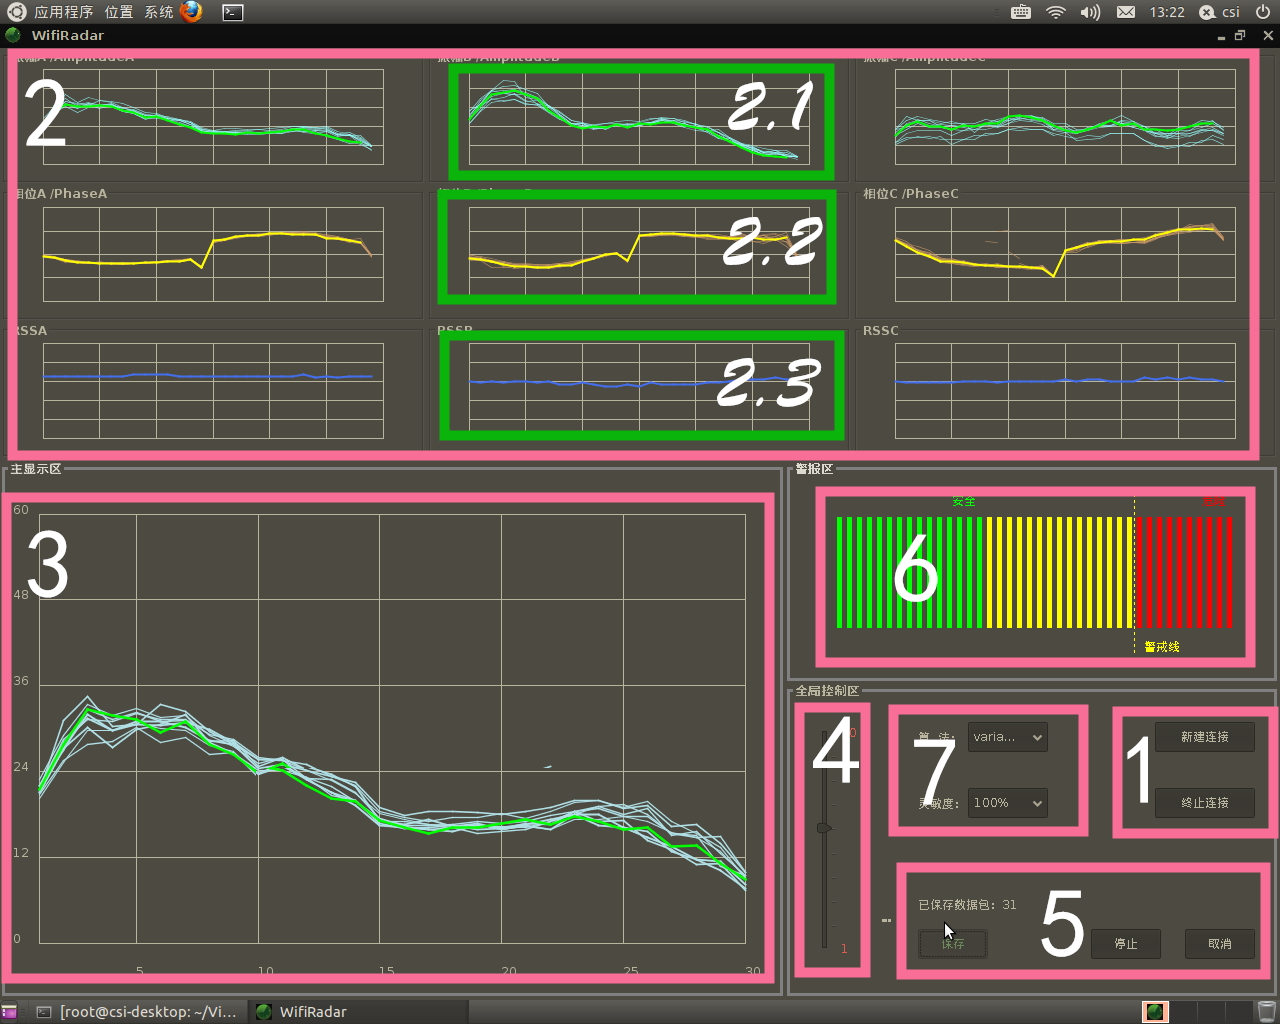
Figure 4. Wi-Fi Radar System Interface

​Real-Time Signal Feature Management

​Creating New Connection (box 1)

  1. ​Click "create new connection" button in lower right corner, the "new connection" dialog box will pop up.
  2. ​Enter the IP address of back-end program in "Server IP Address".
  3. ​In "Local IP Address" text box, fill in the IP address of front-end program.
  4. ​Click "OK" button to run the program, as shown in Figure 5.

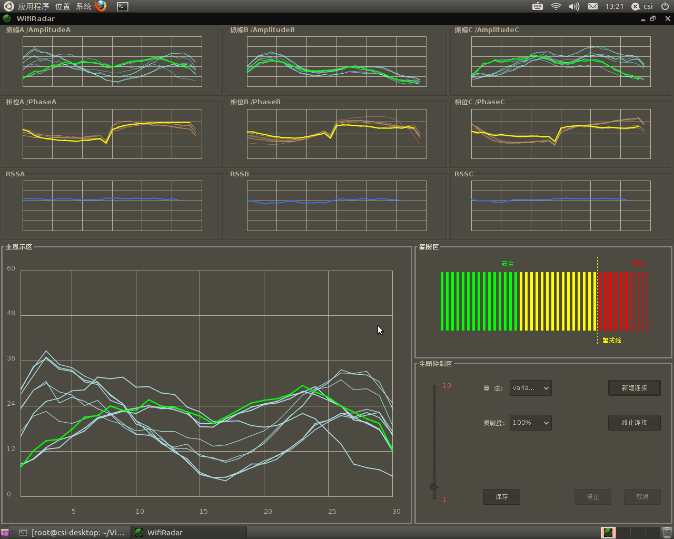
Figure 5. The interface of connecting successfully

​Real-Time Signal Feature Display (box 2)

  1. ​The three small windows from left to right in the frame 2 in figure 4 are wireless channel information received from antennas A, B and C, respectively.
  2. ​The three small windows from top to bottom in each column (for example, boxes 2.1, 2.2 and 2.3 in figure 4) respectively display the amplitude, phase and RSS value of the antenna in real time.
  3. ​The abscissa of the RSSI window is time and the ordinate is the RSSI value. Users can know the changes in the wireless signal power by observing the fluctuations of RSSI value in the window.

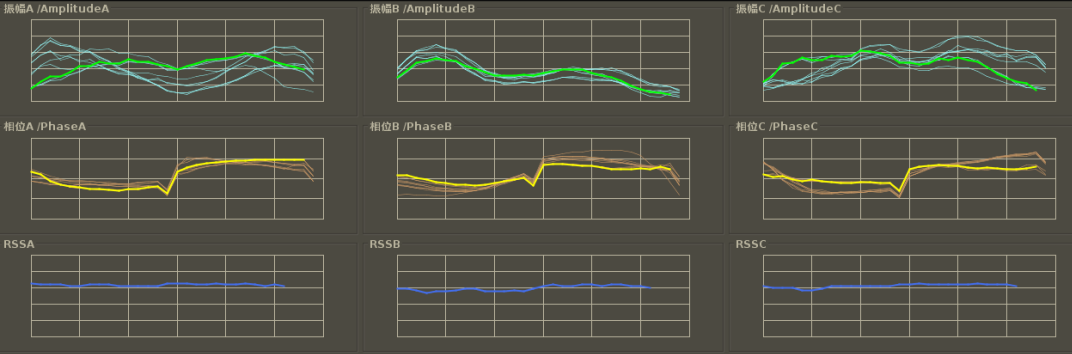
Figure 6. Display of signal features

​Display of Signal Feature Amplification (Box 3)

Click on each of the widgets in Box 2 and signal information will show in the highlighted area of Box 3 (as shown in Figure 7). Users can observe the changes of each sub-carrier or signal features more clearly .

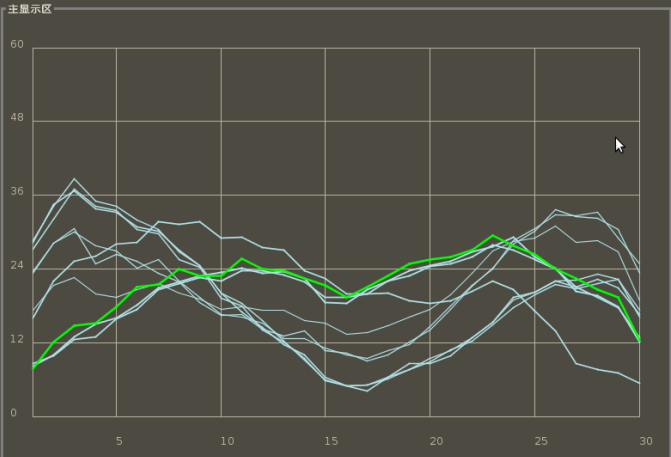
Figure 7. Display of signal amplification

​Packet Frequency Regulation (Box 4)

  1. ​Slide the frequency adjustment bar in figure 4, box 4 to adjust the ICMP packet rate of back-end program.
  2. ​As shown in figure 8, the value of the frequency adjustment bar can be set from 1 to 10, corresponding to the packet frequency from 1Hz to 10Hz.

Figure 8. Frequency regulation area

​Saving data (box 5)

  1. ​The box 5 in figure 4 provides the data saving function of signal features (as shown in figure 9).

    Figure 9. Signal data saving
  2. ​Human Detection Alarms

    ​Human detection functions include alarm indication area and selection of detection parameters.

    Alarm Indication Area (Box 6)

    Functions described in 3.2 and 3.3 can enable users to observe changes of signal features in real time and help them make intuitive and qualitative analysis of feature changing.


    Figure 10. Alarming indication area
    ​As shown in the box 6 in figure 4, alarm indication area is divided into three sections: safety (green), warning (yellow) and alarm (red).

    ​Parameter Selection (box 7)

    ​The system integrates two human detection algorithms. One is based on signal amplitude variance and the other is based on amplitude average.


    Figure 11. Detecting algorithm control area

    ​Algorithm Design and Application Examples

    ​We use human detection and localization as a typical example to help teachers and students understand the use of WiFi radar system. Human detection could be used in security systems. This example is only used to demonstrate how to use this system to realize simple human detection. Because the demo algorithm is too simple, there is room for improvement in both accuracy and robustness. Users should design algorithms based on CSI data provided by the system to achieve specific purpose.
    ​After original data is collected, it needs to be processed into the format required by the experiment. In this experiment, we need to extract the amplitude and phase of the signals from the CSI in the complex form as eigenvalue of the CSI data.
    ​In order to observe the signal changes in the time domain, WiFi radar uses the amplitude and variance information to determine the stability of the surrounding environment in order to detect human motion. After completing the data processing, the WiFi radar stores the carrier amplitude of the data packet in a buffer (time window). The buffer is set to hold information of 30 packets. Carrier amplitude information in the buffer can be represented by a 30 by 30 matrix, as shown in Figure 12.


    Figure 12. CSI matrix variance diagram
    ​Then through the experiment, we can get the range of the I that indicates the degree of CSI stability under different conditions. Wi-Fi radar system can be roughly divided into three parts to indicate degree of indoor safety.

    Figure 13. Probability density curve of I in the static environment
    ​As shown in Figure 13, when there is no one in the room, affected by the residual noise, the distribution of probability density curve of I is approximately Gaussian distribution. When value of I is in the green part of the graph, the room can be considered absolutely safe; the yellow part of the graph can be considered as a warning range (I0 ~ I1), or unpredicted noise or minor effects. At this moment, the situation in the room needs to be taken seriously. When someone moves in the room, the value of I will exceed the red warning threshold I1, and now the WiFi radar system will trigger an intrusion alarms.

    ​Above is design and implementation process of human motion detection algorithm based on the amplitude and variance of WiFi Radar. We believe teachers and students can think out more innovative human detection algorithms referring to above analysis.

    Postscript

    All the password of the system is 123456